![]()
![]()
Profit Potential.
Using the preceding sales and expense analyses, income projections werecalculated for .5, 1, 5, and 10% of the market share for sales of both $1,500,$2,000, and $2,500 per school. The data indicates a break-even point ofapproximately 1% in sales for the $1,500 per school average, 0.6% in salesfor the $2,000 per school average and less than 0.5% in sales for the $2,500per school average. Tables 5, 6, and 7, along with their accompanying chartspresent these projections in detail.
Table 5 - Profit Potential for Sales of $1,500/year perschool
Market Share | 0.5% | 1.0% | 5.0% | 10.0% |
Gross Sales | $614,199.00 | $1,228,399.00 | $6,141,994.00 | $12,283,988.00 |
Cost of Goods | $368,520.00 | $737,039.00 | $3,685,196.00 | $7,370,393.00 |
Gross Profit | $245,680.00 | $491,360.00 | $2,456,798.00 | $4,913,595.00 |
Marketing |
|
|
|
|
Fixed Costs | $256,752.00 | $256,752.00 | $256,752.00 | $256,752.00 |
Variable Costs | $68,497.00 | $137,049.00 | $671,542.00 | $1,370,434.00 |
| Marketing Costs | $325.249.00 | $393,801.00 | $928,294.00 | $1,627,186.00 |
| ||||
| Net Profit | ($79,569.00) | $97,559.00 | $1,528,504.00 | $3,286,409.00 |
Table 6 - Profit Potential for Sales of $2,000/year perschool
Market Share | 0.5% | 1.0% | 5.0% | 10.0% |
Gross Sales | $818,933.00 | $1,637,865.00 | $8,189,325.00 | $16,378,650.00 |
Cost of Goods | $491,360.00 | $982,719.00 | $4,9132,595.00 | $9,827,190.00 |
Gross Profit | $327,573.00 | $655,146.00 | $3,275,730.00 | $6,551,460.00 |
Marketing |
|
|
|
|
Fixed Costs | $256,752.00 | $256,752.00 | $256,752.00 | $256,752.00 |
Variable Costs | $83,852.00 | $167,759.00 | $825,092.00 | $1,677,534.00 |
| Marketing Costs | $340,604.00 | $424,511.00 | $1,081,844.00 | $1,934,286.00 |
| ||||
| Net Profit | ($13,031.00) | $230,635.00 | $2,193,886.00 | $4,617,174.00 |
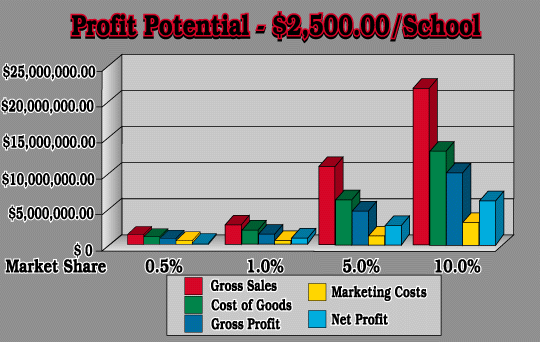
Market Share | 0.5% | 1.0% | 5.0% | 10.0% |
Gross Sales | $1,023,666.00 | $2,047,331.00 | $10,236,656.00 | $20,473,313.00 |
Cost of Goods | $614,199.00 | $1,228,399.00 | $6,141,994.00 | $12,283,988.00 |
Gross Profit | $409,466.00 | $818,933.00 | $4,094,663.00 | $8,198,325.00 |
Marketing |
|
|
|
|
Fixed Costs | $256,752.00 | $256,752.00 | $256,752.00 | $256,752.00 |
Variable Costs | $99,207.00 | $198,469.00 | $978,642.00 | $1,984,634.00 |
| Marketing Costs | $355,959.00 | $455,221.00 | $1,235,394.00 | $2,241,385.00 |
| ||||
| Net Profit | $53,507.00 | $363,712.00 | $2,859,269.00 | $5,947,940.00 |
Chart for Table 7
![]()
![]()